
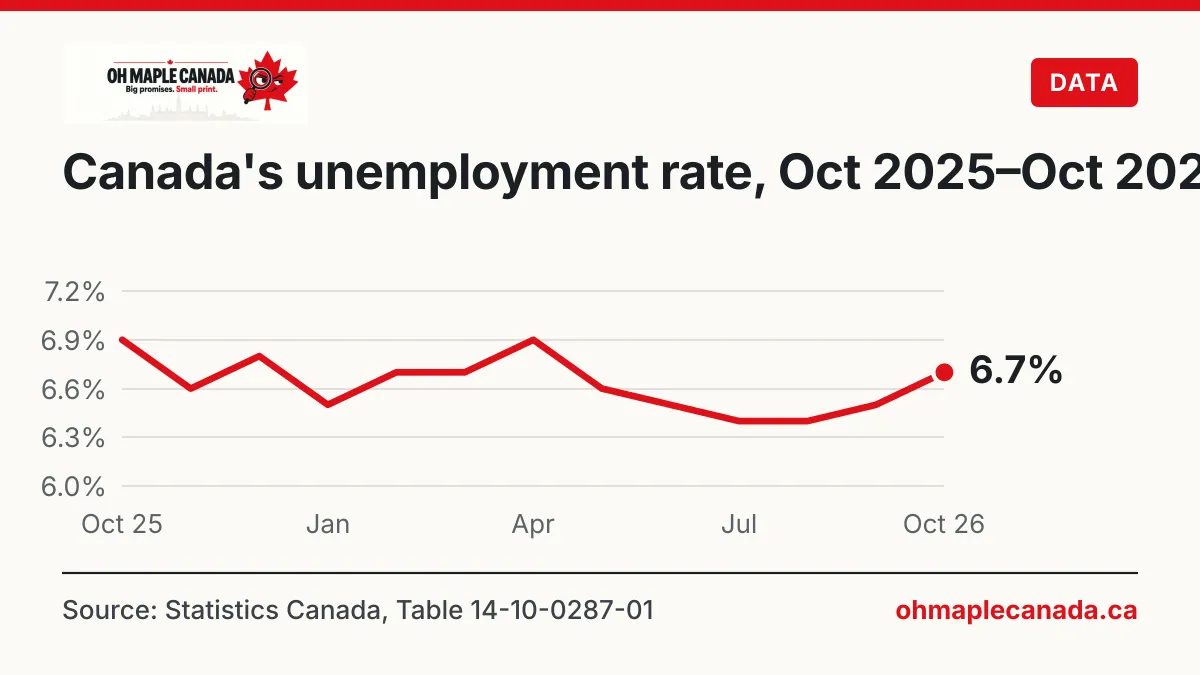
Canada’s unemployment rate rose to 6.7% in October 2026, up from 6.5% in September and its second increase in a row. It is the highest rate since April, when it reached 6.9%.
The headline makes the job market sound like it is shedding workers. The detail tells a different story: layoffs are low, but getting hired has become noticeably harder.
- 6.7%Unemployment rateOctober 2026, up 0.2 points
- −4,700Change in employmentOctober — "little changed"
- 18.9%Job-finding ratevs 24.6% average, 2017–2019
- 23.7%Unemployed 27+ weeksvs 17.2% average, 2017–2019
A year of drifting sideways
Over the past 12 months the unemployment rate has moved within a narrow band, between 6.4% and 6.9%. It fell through the summer, bottomed at 6.4% in July and August, and has now climbed back for two months.
Source: Statistics Canada, Table 14-10-0287-01, seasonally adjusted, population aged 15+.
Monthly estimates; changes of 0.1 point are often within the survey's margin of error.
View the numbers as a table
| Period | Unemployment rate |
|---|---|
| Oct 25 | 6.9% |
| Nov | 6.6% |
| Dec | 6.8% |
| Jan 26 | 6.5% |
| Feb | 6.7% |
| Mar | 6.7% |
| Apr | 6.9% |
| May | 6.6% |
| Jun | 6.5% |
| Jul | 6.4% |
| Aug | 6.4% |
| Sep | 6.5% |
| Oct 26 | 6.7% |
Employment itself was flat in October (−4,700, or 0.0%), following declines of 68,000 in September and 42,000 in August. What pushed the rate up was the number of people looking for work: it rose by about 33,000 (+2.2%) to roughly 1.5 million.
The employment rate — the share of people aged 15 and older who have a job — slipped to 60.5%, its third monthly decline in a row.
The real shift: job seekers are waiting longer
Statistics Canada tracks two flows that explain more than the headline rate.
The layoff rate was 0.7% in October, close to 0.6% a year earlier. Workers are not being let go in unusual numbers.
The job-finding rate — the share of people unemployed in one month who are working the next — tells the other half of the story. It was 18.9% in October, down from 19.8% a year earlier and well below the 24.6% average of 2017 to 2019.
Source: Statistics Canada, Labour Force Survey, October 2026.
View the numbers as a table
| Item | Value |
|---|---|
| Average 2017–2019 | 24.6% |
| October 2025 | 19.8% |
| October 2026 | 18.9% |
When people find work more slowly, more of them stay unemployed for a long time. In October, 23.7% of unemployed people had been searching for 27 weeks or more, up from 21.5% a year earlier and far above the pre-pandemic average of 17.2%.
The longest searches are concentrated among older workers: 32.7% of unemployed people aged 55 and over were long-term unemployed, up from 27.9% a year earlier.
Source: Statistics Canada, Labour Force Survey, October 2026.
View the numbers as a table
| Item | Value |
|---|---|
| Average 2017–2019 | 17.2% |
| October 2025 | 21.5% |
| October 2026, all ages | 23.7% |
| October 2026, aged 55+ | 32.7% |
Private sector down, public sector back up
The October total hides two large moves in opposite directions. Private-sector employees fell by 53,000 (−0.4%), the first decline since February. Public-sector employees rose by 50,000 (+1.1%), after four monthly declines that together removed 148,000 public-sector jobs.
Over 12 months the picture is reversed: the public sector is down 70,000 employees and the private sector is up 35,000.
Source: Statistics Canada, Labour Force Survey, October 2026. Industry and sector figures overlap and should not be added together.
View the numbers as a table
| Item | Value |
|---|---|
| Public-sector employees | +50 |
| Construction | +16 |
| Educational services | +15 |
| Wholesale and retail | -29 |
| Private-sector employees | -53 |
Wholesale and retail trade carried much of the private-sector weakness: employment there fell by 29,000 in October and is down 113,000 (−3.7%) from a year earlier.
Where unemployment is highest
Newfoundland and Labrador had the highest unemployment rate in October at 8.7%. Manitoba had the lowest at 5.0%.
The sharpest move was in Alberta, where the rate jumped 0.9 points to 7.3% as employment fell by 24,000. Alberta now matches Ontario at 7.3%; Ontario’s rate rose 0.3 points. Quebec’s rate fell 0.3 points to 5.7%.
Source: Statistics Canada, Table 14-10-0287-01, seasonally adjusted. Canada-level estimates exclude the territories.
View the numbers as a table
| Item | Value |
|---|---|
| Newfoundland and Labrador | 8.7% |
| Prince Edward Island | 7.4% |
| New Brunswick | 7.4% |
| Ontario | 7.3% |
| Alberta | 7.3% |
| Canada | 6.7% |
| British Columbia | 6.3% |
| Nova Scotia | 6.2% |
| Saskatchewan | 5.9% |
| Quebec | 5.7% |
| Manitoba | 5.0% |
Young workers lose the most ground
Unemployment among people aged 15 to 24 rose 0.7 points to 13.7% in October, close to its 12-month high of 14.3% in April. The rate for workers aged 25 to 54 was 5.6%, little changed over the year.
Source: Statistics Canada, Table 14-10-0287-01, seasonally adjusted.
View the numbers as a table
| Period | Aged 15–24 | Aged 25–54 | Aged 55+ |
|---|---|---|---|
| Oct 25 | 14.0% | 5.8% | 5.3% |
| Nov | 12.8% | 5.6% | 5.3% |
| Dec | 13.3% | 6.0% | 5.1% |
| Jan 26 | 12.8% | 5.5% | 5.1% |
| Feb | 14.1% | 5.7% | 4.9% |
| Mar | 13.8% | 5.8% | 4.9% |
| Apr | 14.3% | 6.0% | 4.9% |
| May | 13.4% | 5.6% | 5.0% |
| Jun | 12.7% | 5.6% | 5.2% |
| Jul | 12.6% | 5.5% | 5.2% |
| Aug | 12.9% | 5.5% | 5.1% |
| Sep | 13.0% | 5.6% | 5.3% |
| Oct 26 | 13.7% | 5.6% | 5.5% |
Among young people, the unemployment rate was 13.5% for students and 12.3% for those not attending school.
Pay is rising more slowly than prices
Average hourly wages for employees were up 2.2% from a year earlier, to $37.89. That is below the 3.1% inflation rate Statistics Canada reported for September. October inflation figures are not yet published, so the comparison is indicative rather than exact.
The October survey also asked about household finances: 29.7% of Canadians lived in households that had difficulty meeting their financial needs, up from 27.7% a year earlier. The share was highest in Oshawa (38.4%), Windsor (36.9%) and Hamilton (35.9%).
What the data can and cannot tell us
The Labour Force Survey describes the job market; it does not explain why hiring has slowed. Weaker demand in some industries, U.S. tariffs, interest rates and changes in population growth may all play a part, but this release does not measure their contribution.
Responsibility is also shared. Federal policy influences trade, immigration and employment insurance; provinces run most training and workforce programs; employers decide whom to hire.
Method notes: October estimates reflect the week of October 11 to 17, 2026. The survey covers about 65,000 households a month and excludes the territories from national totals. Monthly changes are estimates with a margin of error; Statistics Canada highlights differences significant at the 68% confidence level. The next Labour Force Survey, for November, is scheduled for December 4, 2026.
Related: Budget 2026 in charts.