
Finance Minister François-Philippe Champagne tabled Budget 2026 on November 5. Its fiscal tables project a federal deficit of $62.3 billion for 2026–27 and deficits above $50 billion in every year through 2030–31.
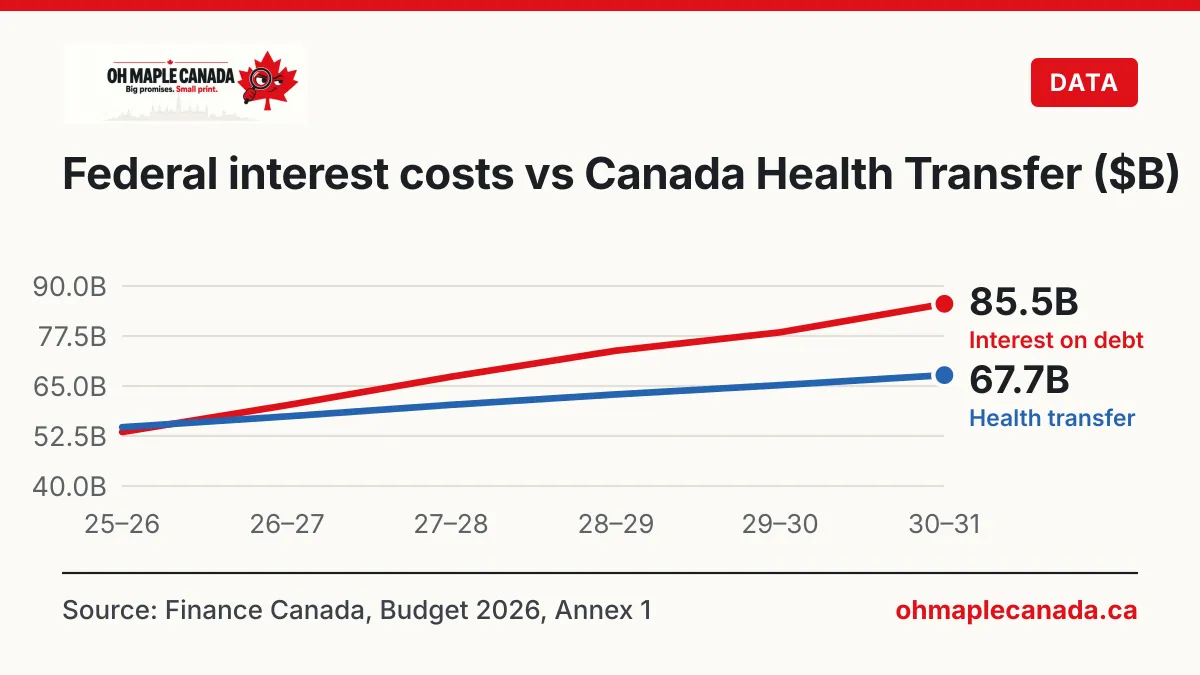
The most talked-about line is not the deficit. It is the cost of carrying the debt: this year, Ottawa expects to spend more on interest than it sends the provinces through the Canada Health Transfer.
- $62.3BProjected deficit2026–27
- $60.2BInterest on federal debt"Public debt charges," 2026–27
- $57.4BCanada Health Transfer2026–27
- 39.9%Federal debt to GDP2026–27
1. The deficit path barely moved
Since April’s Spring Economic Update, stronger revenues — which private-sector economists largely attribute to higher oil prices and inflation — improved Ottawa’s books. Most of that improvement was spent on new measures, so the projected deficits end up close to the spring plan.
Source: Department of Finance Canada, Budget 2026 and Spring Economic Update 2026, Annex 1. Deficits shown as positive numbers.
View the numbers as a table
| Period | Budget 2026 | Spring Update 2026 |
|---|---|---|
| 2026–27 | 62.3B | 65.3B |
| 2027–28 | 62.5B | 63.1B |
| 2028–29 | 57.6B | 57.7B |
| 2029–30 | 53.4B | 56.2B |
| 2030–31 | 52.9B | 53.2B |
The 2026–27 deficit is $3.0 billion smaller than projected in the spring. By 2030–31 the two plans differ by just $0.3 billion. Over the five years, Budget 2026 projects $288.7 billion in combined deficits.
Before the budget, the Parliamentary Budget Officer’s October outlook projected a $63.3-billion deficit for 2026–27 rising to a peak of $70.2 billion in 2027–28. That projection was based on policies in place before the budget, so it is not a direct forecast of the budget plan.
2. Interest costs pass the health transfer
Public debt charges — the interest Ottawa pays on what it has borrowed — are projected to rise from $53.5 billion in 2025–26 to $85.5 billion in 2030–31, an increase of about 60%. The Canada Health Transfer grows by about 24% over the same period, from $54.7 billion to $67.7 billion.
The two lines cross this year. By 2030–31, interest costs exceed the health transfer by $17.8 billion.
Source: Department of Finance Canada, Budget 2026, Annex 1 (Tables A1.8 and A1.10). 2025–26 figures are Budget 2026 estimates.
View the numbers as a table
| Period | Public debt charges | Canada Health Transfer |
|---|---|---|
| 2025–26 | 53.5B | 54.7B |
| 2026–27 | 60.2B | 57.4B |
| 2027–28 | 67.3B | 60.3B |
| 2028–29 | 73.8B | 62.9B |
| 2029–30 | 78.4B | 65.2B |
| 2030–31 | 85.5B | 67.7B |
Two points of context matter here.
First, the Canada Health Transfer is not total health spending. Provinces and territories run and pay for most health care; the transfer is Ottawa’s contribution. The comparison shows how fast interest is growing relative to one large federal commitment, not that Canada spends more on interest than on health care.
Second, Finance Canada argues that debt charges remain low relative to the size of the economy. In its spring projection it put debt charges at about 1.7% of GDP for 2026–27, below the 3.2% average of the past 40 years. Both statements can be true: interest is low by historical standards as a share of GDP, and it is rising faster than most federal programs.
Measured against federal revenue, interest takes about 11 cents of every dollar in 2026–27 and nearly 14 cents by 2030–31, on Budget 2026’s projections.
3. Two ways to measure the deficit
Ottawa now reports a second figure alongside the traditional deficit: the “day-to-day operating balance.” It separates everyday program costs from spending the government classifies as capital investment, such as infrastructure and other spending it classifies as capital.
On that measure, the budget moves from a $3.5-billion operating deficit this year to a surplus from 2027–28 onward. On the full budgetary balance — the measure used in the Public Accounts — the government stays in deficit every year.
Source: Department of Finance Canada, Budget 2026, Annex 1 (Tables A1.6 and A1.8). Negative values are deficits.
View the numbers as a table
| Period | Operating balance | Full budgetary balance |
|---|---|---|
| 2026–27 | -3.5B | -62.3B |
| 2027–28 | 11.2B | -62.5B |
| 2028–29 | 20.3B | -57.6B |
| 2029–30 | 24.6B | -53.4B |
| 2030–31 | 25.2B | -52.9B |
Supporters say the split shows that borrowing is going to long-lived assets that can raise future growth. Critics, including the Parliamentary Budget Officer, have said the government’s fiscal anchors impose limited discipline, because what counts as “capital” is a policy choice. Whether the investments raise productivity will only be visible over several years.
4. The debt grows, the ratio holds
Federal debt is projected to rise from $1.37 trillion in 2026–27 to $1.59 trillion in 2030–31. Because the economy is also projected to grow, the debt stays close to 40% of GDP throughout.
Source: Department of Finance Canada, Budget 2026, Annex 1 (Table A1.8).
A stable ratio depends on the budget's growth projections; slower growth would push it higher.
View the numbers as a table
| Period | Federal debt-to-GDP |
|---|---|
| 2026–27 | 39.9% |
| 2027–28 | 40.2% |
| 2028–29 | 40.4% |
| 2029–30 | 40.3% |
| 2030–31 | 40.1% |
5. What it means per person
Dividing by Canada’s population of about 41.8 million (Statistics Canada, July 1, 2026) puts the 2026–27 numbers on a human scale.
Source: Oh Maple Canada calculation from Budget 2026, Annex 1, and Statistics Canada population estimate for July 1, 2026 (41,798,407).
View the numbers as a table
| Item | Value |
|---|---|
| Deficit | 1,490 |
| Interest on federal debt | 1,440 |
| Canada Health Transfer | 1,373 |
Federal debt works out to roughly $32,700 per person in 2026–27.
What the budget tables do not settle
These are projections, not results. They depend on assumptions about oil prices, interest rates, tariffs and growth that can change quickly. Higher-than-assumed interest rates would raise debt charges; a weaker economy would lower revenue.
Budget 2026 records the 2025–26 deficit at $39.3 billion. That differs from the preliminary $55.3-billion figure in Finance Canada’s March Fiscal Monitor, which was published before year-end adjustments. This article does not rely on the 2025–26 deficit figure; final results are published in the Public Accounts of Canada.
Related: Canada’s unemployment rate rises to 6.7%.