
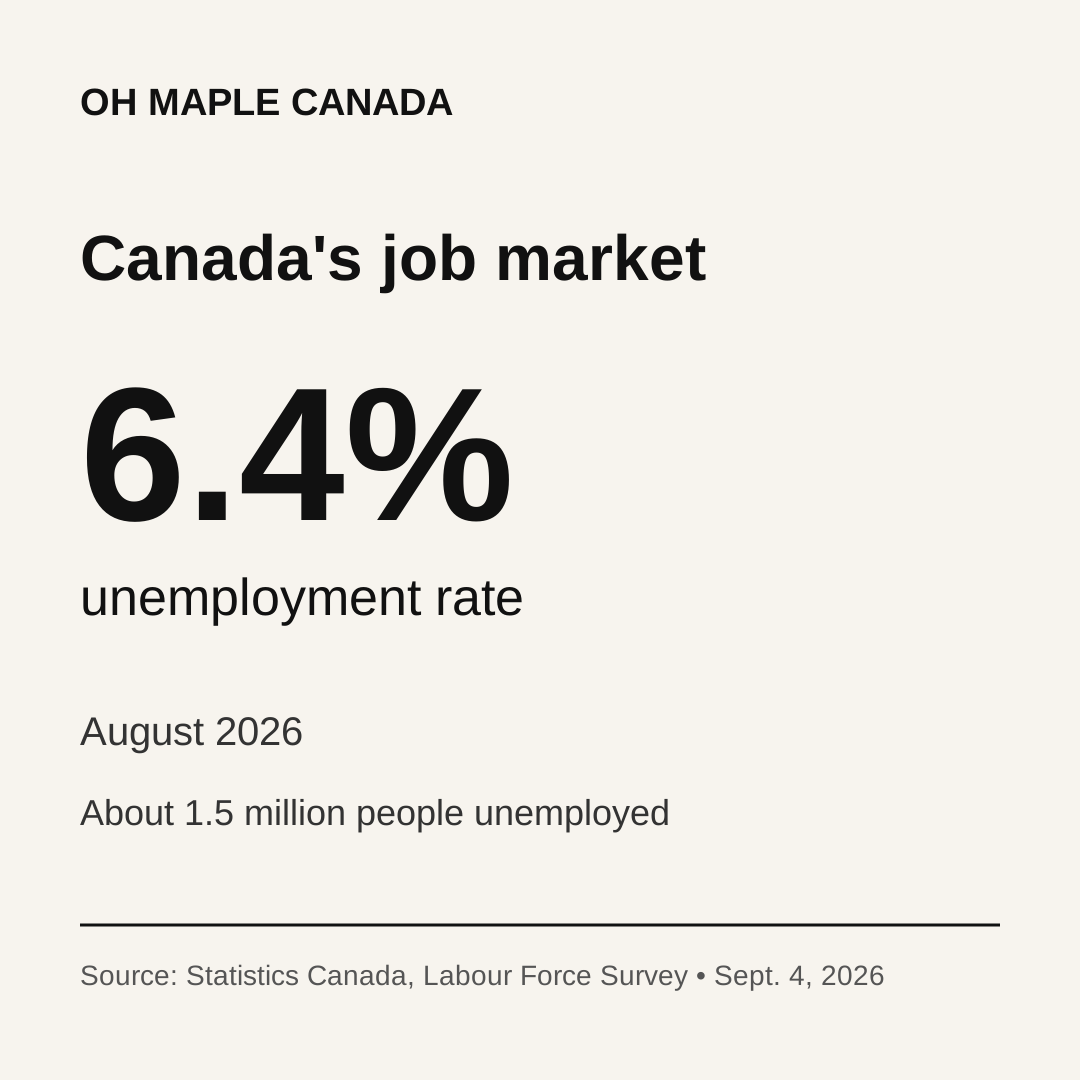
Canada’s job market delivered a better headline this summer than it did a year ago. The unemployment rate was 6.4% in August 2026, down from 7.1% in August 2025.
Source: Statistics Canada, Labour Force Survey, August 2026.
That improvement is real. It is also incomplete.
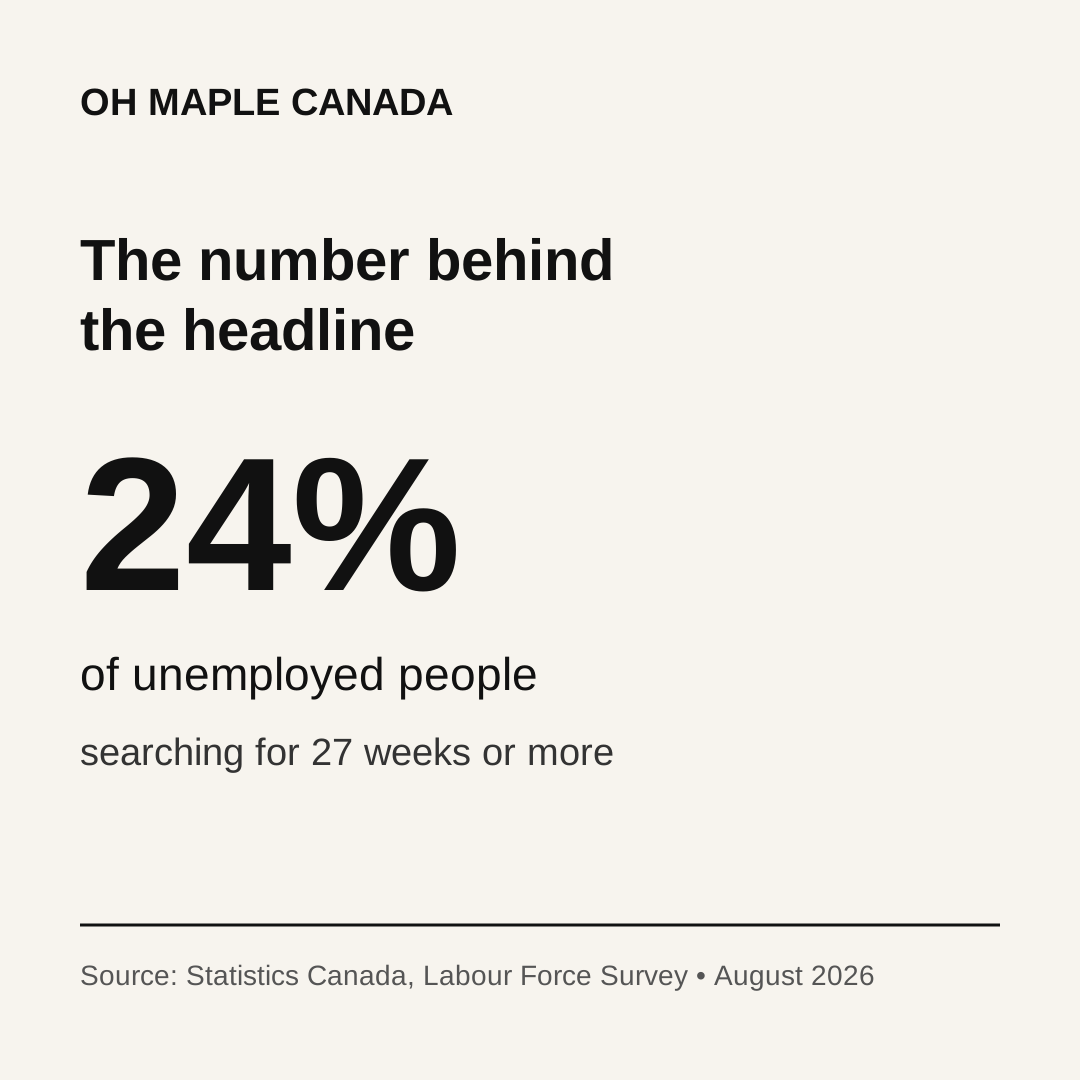
Behind the national unemployment rate is another number that helps explain why many job seekers experience the labour market very differently from the headline: 24.0% of unemployed people had been searching continuously for work for 27 weeks or more.
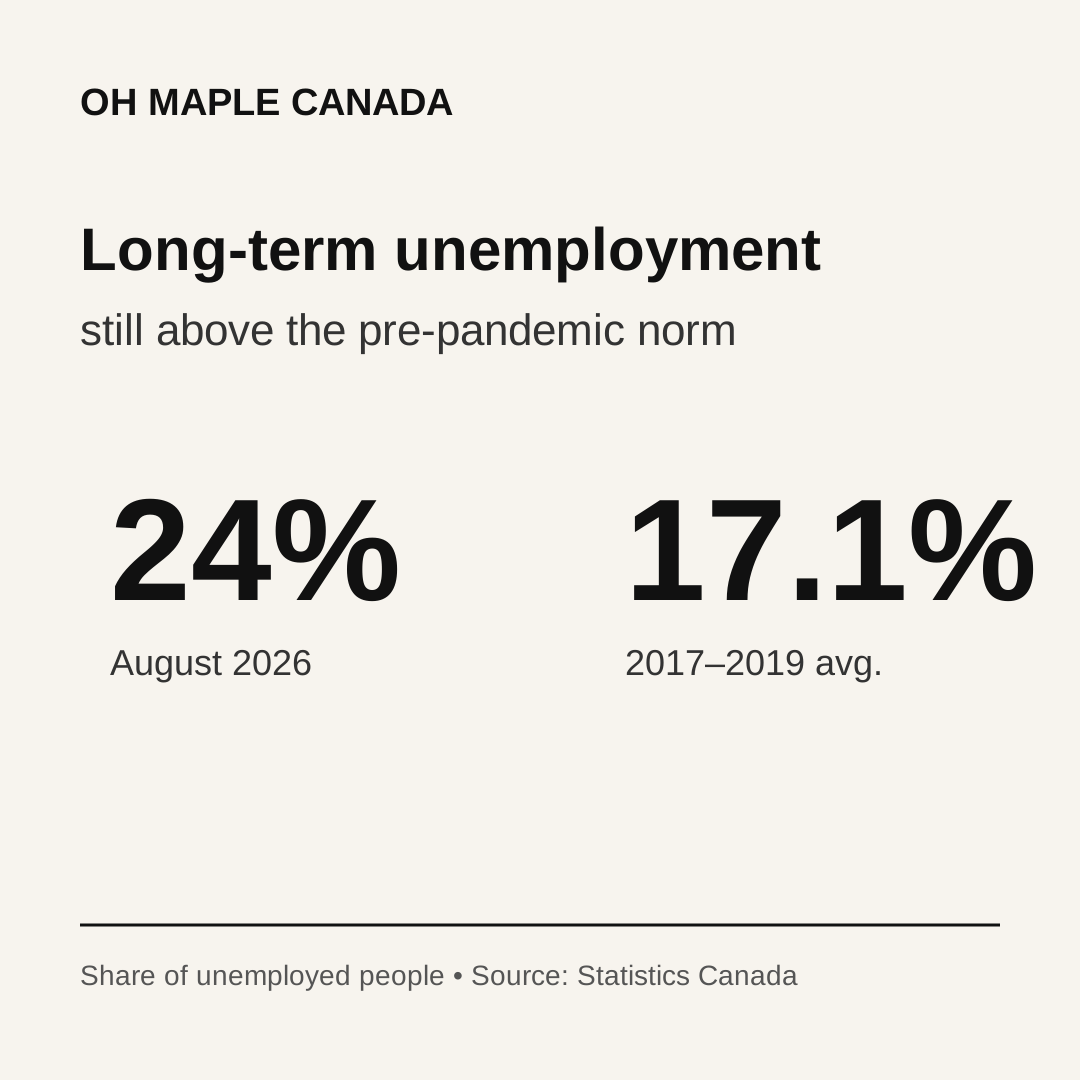
Statistics Canada classifies that as long-term unemployment. Before the pandemic, the comparable share averaged 17.1% from 2017 to 2019.
So the central question is not only how many people are unemployed. It is also how long people who lose work, or are trying to enter work, remain outside employment.
What changed in August
Statistics Canada’s September 4 Labour Force Survey estimated employment at 21.173 million in August. Employment declined by 42,000, or 0.2%, during the month, while the employment rate slipped 0.1 percentage points to 60.8%.
The unemployment rate held at 6.4%, following three consecutive monthly declines from May through July. Approximately 1.5 million people were unemployed.
The participation rate—the share of people aged 15 and older who were working or actively looking for work—fell 0.1 percentage points to 65.0%.
Those figures describe a labour market that improved from the more difficult conditions of 2025 but did not strengthen in August itself.
The number worth watching: 24%
Among unemployed people in August, 24.0% were in long-term unemployment, meaning they had been continuously searching for at least 27 weeks.
Source: Statistics Canada, Labour Force Survey, August 2026.
The share was similar to 23.0% in August 2025, but materially above the 17.1% average from 2017 through 2019.
Source: Statistics Canada, Labour Force Survey, August 2026.
The unemployment rate and long-term unemployment answer different questions. The first measures the share of the labour force that is unemployed and actively seeking work. The second tells us how persistent unemployment is among those already searching.
A falling headline rate can therefore coexist with a difficult experience for people who have already spent months looking for work.
This is not simply a story about layoffs
It is tempting to interpret prolonged unemployment as evidence of a wave of layoffs. The August data do not support that simple conclusion.
Statistics Canada measured the August layoff rate at 0.8%, slightly below the 1.0% rate a year earlier and close to the 0.9% average for corresponding months from 2017 to 2019.
That means the persistence of long-term unemployment cannot be explained by layoffs alone.
The Labour Force Survey does not establish that hiring software, credential requirements, employer caution, skills mismatch or any single policy is responsible. Those may be relevant subjects for separate analysis, but assigning causation requires evidence beyond this release.
What the survey does establish is that a larger share of unemployed people remain out of work for an extended period than was typical immediately before the pandemic.
Young workers still face a tougher market
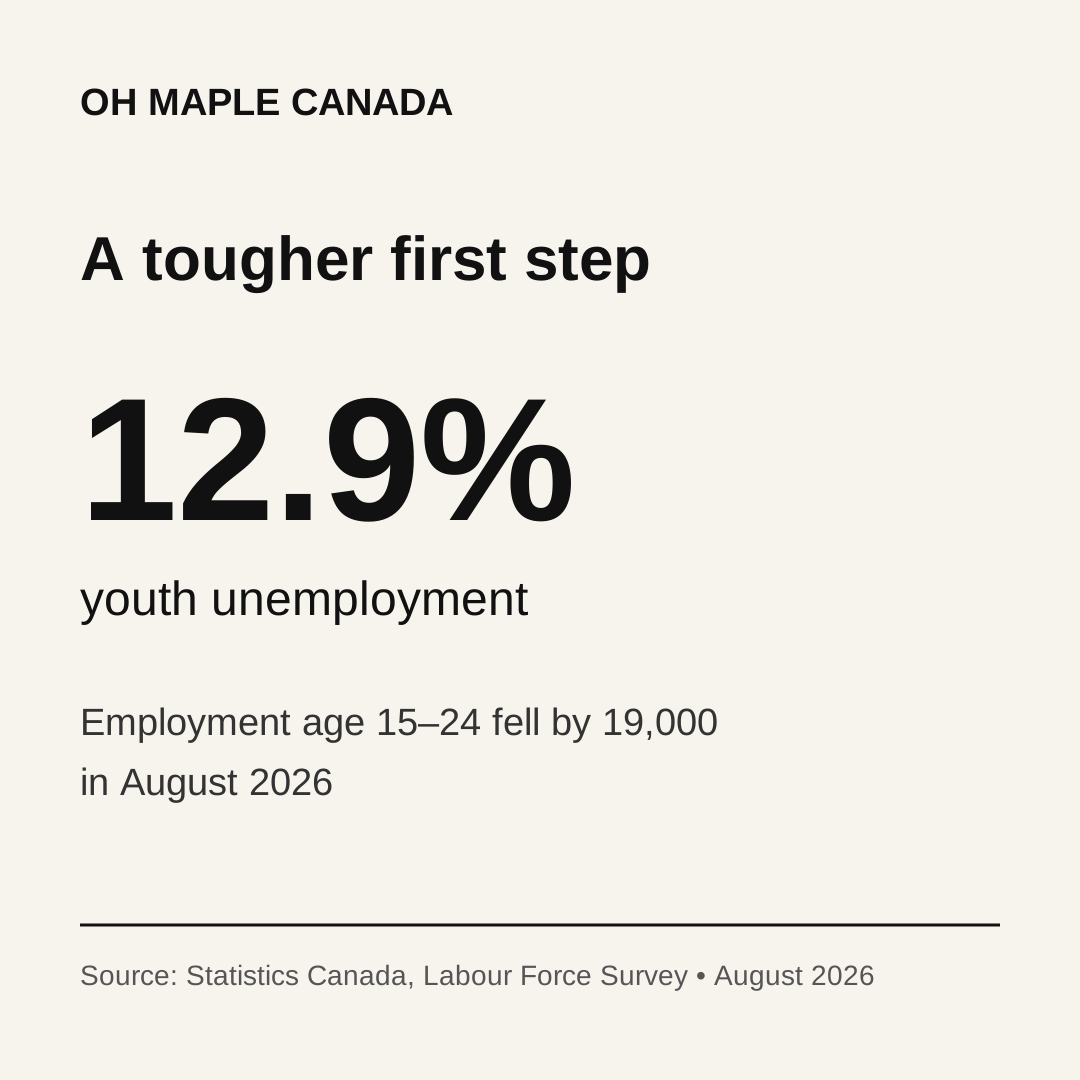
Youth unemployment was 12.9% in August. Employment among people aged 15 to 24 fell by 19,000 during the month.
Source: Statistics Canada, Labour Force Survey, August 2026.
There is some encouraging context. Among returning students, the average unemployment rate from May through August 2026 was 15.9%, down from 17.9% during the same period in 2025. For returning students aged 20 to 24, it fell to 9.2% from 12.3% a year earlier.
But youth unemployment remained above the 10.8% pre-pandemic average for 2017–2019.
Youth figures should be interpreted carefully because school attendance and seasonal work make this segment different from the core working-age population. Still, the data show that getting the first foothold in employment remains difficult for many young Canadians.
The picture is uneven across industries and provinces
Employment declined in business, building and other support services, public administration, natural resources and utilities in August. Manufacturing was the only sector to record a statistically significant monthly increase, adding 22,000 jobs.
Over the preceding 12 months, employment growth was concentrated in health care and social assistance, information, culture and recreation, and transportation and warehousing. Wholesale and retail trade recorded the largest year-over-year decline.
Ontario’s unemployment rate was 6.9% in August, down 0.8 percentage points from August 2025. Toronto’s rate was 6.7%, below its recent high of 9.0% in July 2025. Quebec employment declined by 19,000 in August, while New Brunswick posted an increase and most other provinces changed little.
The national rate is useful, but it should not be mistaken for a description of every local labour market.
Wages are still growing—but more slowly
Average hourly wages among employees were $37.02 in August, up 2.0% year over year. That followed 2.8% annual wage growth in July.
Statistics Canada noted that August’s annual wage growth was the slowest since November 2017, excluding 2021. Growth was also slower for employees in the bottom half of the wage distribution than for those in the upper half.
Wage growth matters for household purchasing power, but this Labour Force Survey measure is not a complete cost-of-living scorecard. Whether an individual household is gaining purchasing power depends on prices, hours, earnings and circumstances. That relationship belongs in a separate cost-of-living analysis.
Fact versus analysis
Measured facts: the unemployment rate, employment change, long-term-unemployment share, youth rate, wage growth and sector/provincial changes above come from Statistics Canada’s August 2026 Labour Force Survey.
Analysis: saying the headline improvement is incomplete is our interpretation of those measures taken together. The survey does not prove why long-term unemployment is elevated, so this article does not assign a single cause.
What to watch next
The next Labour Force Survey is scheduled for October 9, 2026 and will cover labour-market conditions during the week of September 13 to 19.
Three indicators deserve particular attention: whether the headline unemployment rate continues to decline, whether employment resumes growth after August’s drop, and whether the long-term-unemployment share begins moving back toward its pre-pandemic range.
A one-month improvement would not settle the issue. Persistent improvement across those measures would be stronger evidence that job seekers are finding their way back into work faster.